
Dashboard & Analytics
See how your business is tracking
Real-time dashboards showing revenue, job volume, crew utilisation, and business health at a glance. Know your numbers without digging through spreadsheets.
Why Dashboard & Analytics
The advantages that make the difference for your moving business.
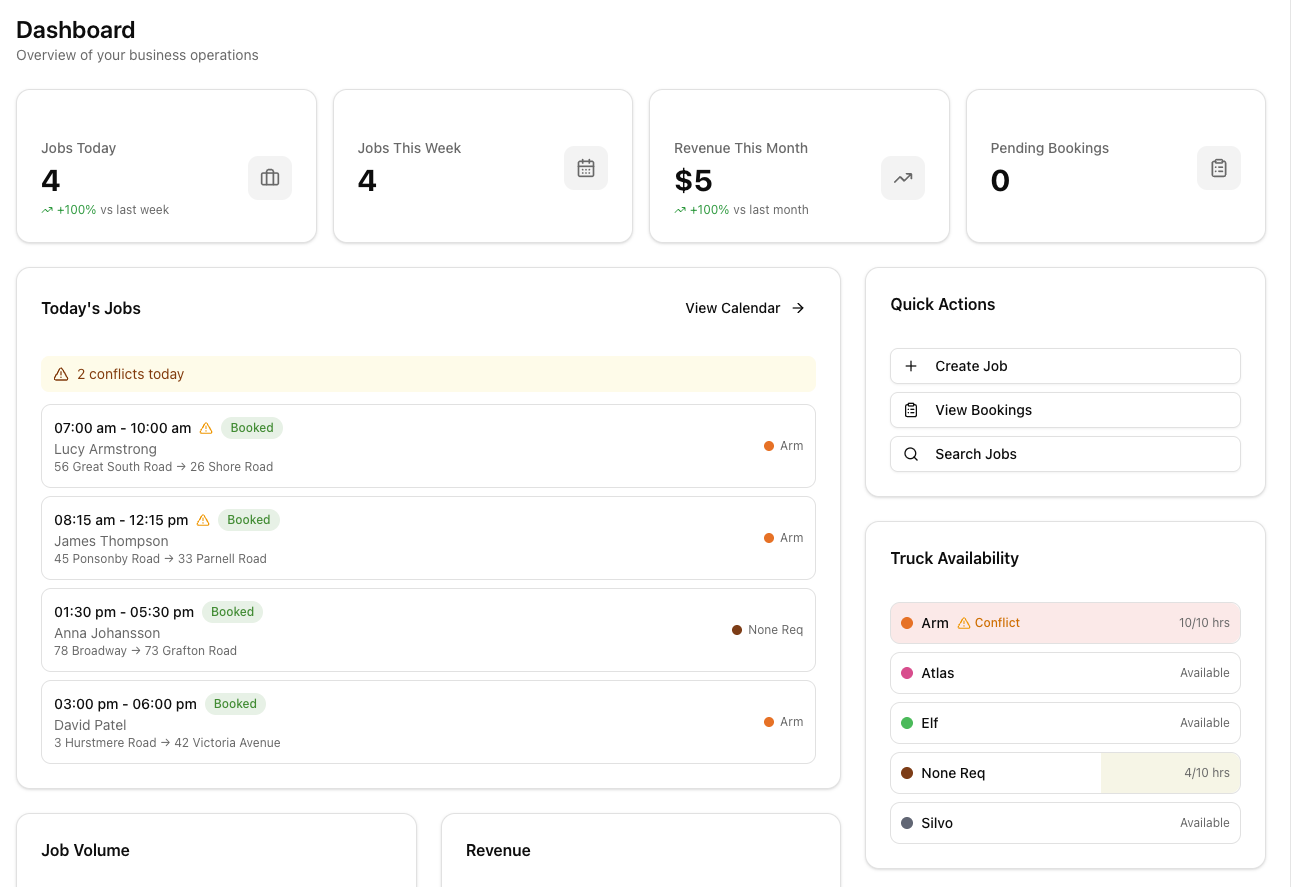
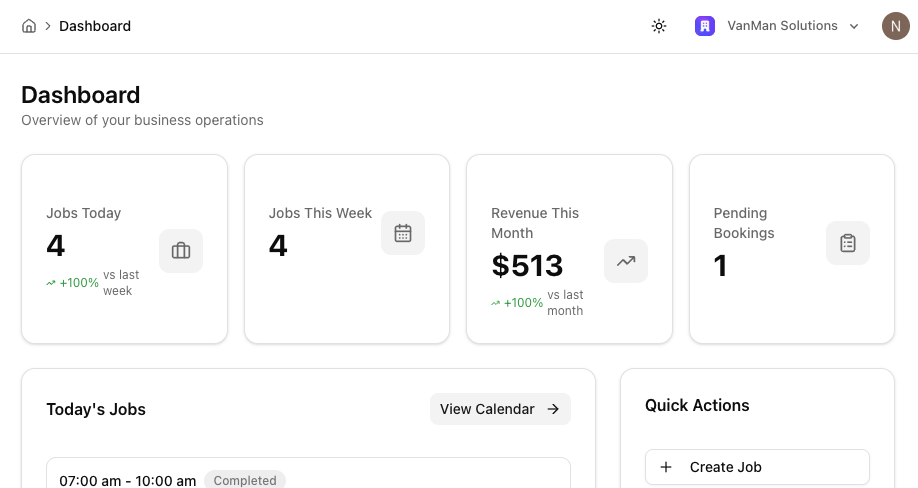
KPI cards with trend indicators
The top of your dashboard shows the numbers that matter most: revenue this month, jobs completed, new bookings, and truck utilisation. Each card includes a trend arrow showing whether you're up or down compared to last period.
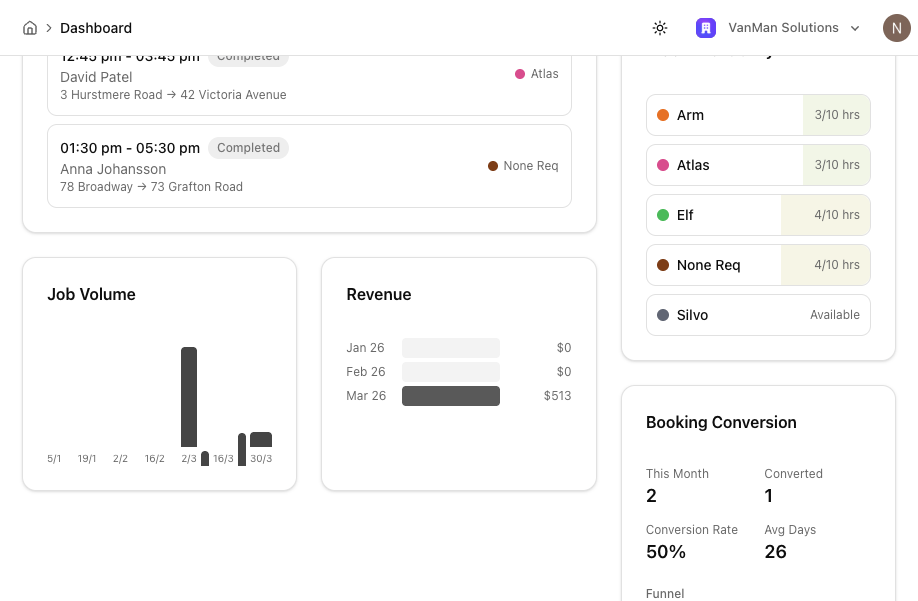
Revenue and job volume charts
Interactive charts show your revenue and job volume over time — daily, weekly, or monthly. Filter by truck, job type, or date range to drill into the details.
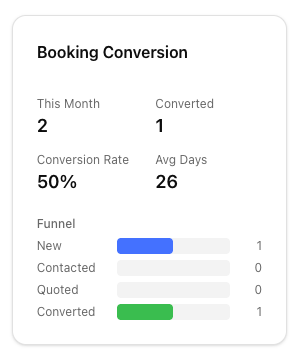
Booking conversion funnel
See how many enquiries become confirmed jobs with a visual conversion funnel. Track each stage — new, contacted, quoted, confirmed — and spot where you're losing potential customers.
Powered by your real data
The dashboard pulls live data from across VanMan — jobs, bookings, invoices, and fleet — so your numbers are always current.
You might also like
See Dashboard & Analytics in action
Start your free trial and explore every feature with your own data.